Solution to question 3.3
The first thing we need to do is make a decision about the minimum and maximum times this sample of dentists is likely to have spent with their patients so that we can decide where to draw the first and last boxes of the histogram. I decided to make the lower limit 10 minutes and the upper one 30 minutes. These figures seemed fairly reasonable and also made the drawing of the histogram simpler as all my 'bins' were 2.5 minutes wide. My table of values was thus:
| Time with dentist | Number of patients |
|---|---|
| 10·0 - 12·5 minutes | 5 |
| 12·5 - 15·0 minutes | 12 |
| 15·0 - 17·5 minutes | 6 |
| 17·5 - 20·0 minutes | 2 |
| 20·0 - 22·5 minutes | 7 |
| 22·5 - 25·0 minutes | 11 |
| 25·0 - 27·5 minutes | 7 |
| 27·5 - 30·0 minutes | 1 |
This gave me the histogram in fig. 1.
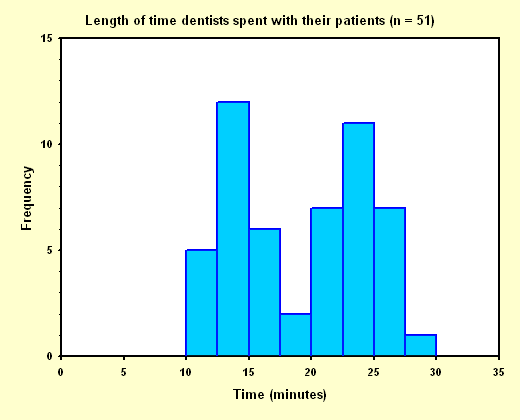
Figure 1
The main feature of this histogram is that it is bimodal, there are two peaks. This is not surprising because this data was actually collected from two very different types of practice in two different countries. Observing features like this in a histogram can give us insights into the data. If we had been unaware of the source of this data we would still have sought an explanation for the bimodality by investigating further.
You may have felt that the assumptions I made about the minimum and maximum times were unreasonable. I have drawn another histogram with different values (fig. 2). I chose 5 minutes as the minimium time. This made the first bin three times as wide as the others so I divided its height by three. I then set the maximum time at 60 minutes. This made the last bin thirteen times as wide as the others so I divided its height by thirteen. This gave me the following table of values for drawing the histogram:
| Time with dentist | Number of patients |
|---|---|
| 5·0 - 12·5 minutes | 1·67 |
| 12·5 - 15·0 minutes | 12 |
| 15·0 - 17·5 minutes |
6 |
| 17·5 - 20·0 minutes | 2 |
| 20·0 - 22·5 minutes | 7 |
| 22·5 - 25·0 minutes | 11 |
| 25·0 - 27·5 minutes | 7 |
| 27·5 - 60·0 minutes | 0·08 |
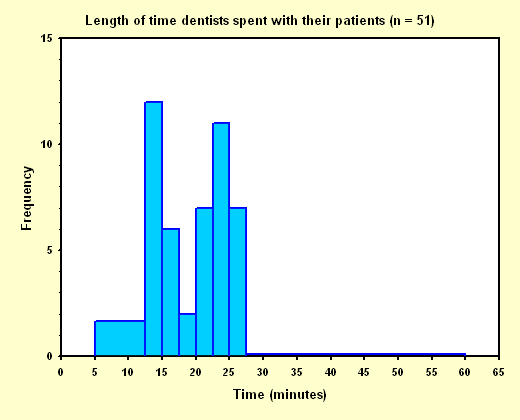
Figure 2
In addition to the same bimodality we saw in fig. 1, fig. 2 could possibly be describes as having a long tail on on the right-hand side and thus positively skewed. It would be unwise to make this conclusion because it would be based on only one observation and also purely on our assumed maximum value. This would make it a very weak, I would say inadmissable, conclusion.