Correlation and regression
Objectives
At the end of the lecture students should be able to:
- Interpret a correlation coefficient
- Be aware of some of the basic problems associated with the use of correlation coefficients
- Know when it is appropriate to use a correlation coefficient and when a regression technique should be used
Correlation
One of the simplest questions we can ask about two variables is: "Is there a linear relationship between them?"
The (Pearson) correlation coefficient, r, is a measure of linear association between two continuous variables. It is a measure of how well the data fit a straight line.
1 => r >= -1
- If r > 0 we have a Positive correlation
- If r < 0 we have a Negative correlation
- If r = 0 we have No correlation
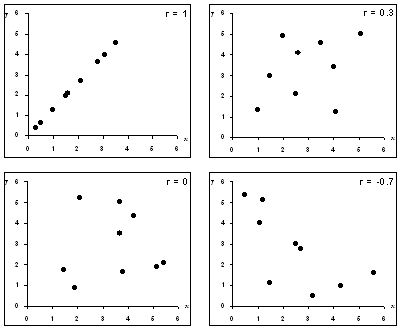
Scatterplots showing data sets with different correlations
We can also perform a hypothesis test, the null hypothesis is that there is no correlation between the two variables (i.e. the population correlation coefficient, r, is zero).
Note:
- It is harder to spot a correlation close to zero, but these are the ones we come across most often
Other points to note:
- The correlation coefficient is unaffected by units of measurement
- Correlations of less than 0·7 should be interpreted cautiously
- Correlation does not imply causation
- Overall, I do not find correlation to be a very useful technique
Correlation should not be used when:
- There is a non-linear relationship between variables
- The are outliers
- There are distinct sub-groups
For example healthy controls with diseased cases - If the values of one of the variables is determined in advance
e.g. Picking the doses of a drug in an experiment measuring its effect
Two examples of when not to use a correlation coefficient:
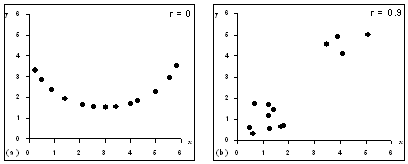
(a) When there is a non-linear relationship; (b) when distinct subgroups are present. In both of these examples the correlation coefficient quoted is spurious.
Spurious correlations crop up all the time:
- The price of petrol shows a positive correlation with the divorce rate over time
- Number of deaths from heart attacks in a population rises with incidence of long-sightedness over time
- Maximum daily air temperature and number of deaths of cattle were positively correlated during March 2001
- If we repeatedly measure two variables on the same individual over a period of time e.g. a child's height and ability to read, then we will tend to see a correlation
Spearman rank correlation coefficient
A (Pearson) correlation coefficient should be only calculated between two normally distributed random variables
The Spearman rank correlation coefficient, rs, can be calculated for non-normally distributed variables. As this coefficient is based only on the ranks of observations outliers do not affect it unduly.
Linear regression
- Regression analysis fits the best line to the observed data and allows us to make predictions about one variable from the values of the other.
- One variable (the independent variable) is assumed to predict the other (the dependent), the results are not the same if we swap the variables.
- The values of the independent variable may be selected.
- The values do not have to be normally distributed
- There are other assumptions and requirements of a regression analysis. (The relationships is approximately linear; the residuals have to be normally distributed etc.)
- Regression analysis is best carried out under the guidance of a statistician
Why are variables correlated?
If two variables, A and B, are correlated then there are four possibilities:
- The result occurred by chance
- A influences ('causes') B (or, B influences A. Not the same thing!)
- A and B are influenced by some other variable(s). This can happen in two ways:
- C may 'cause' both A and B e.g. increased consumption of sugar increases the number of caries a person has and increases their weight. Does more weight cause more caries?
- A may lead to an increase in C which 'causes' B e.g. low income may increase chance of smoking which increases chance of death from lung cancer. Does low income cause lung-cancer?